


Part 4 of a series on scaling data-intensive applications
Coming in 2026: The distributed connector architecture described in this series is planned for an upcoming XMPro release. This series shares our engineering findings and the architectural approach we're taking.
Production performance gets the attention. Dashboards monitor response times. Alerts fire when latency spikes. Teams optimise the paths end users traverse.
But what about the designers building those pages?
Design mode—where developers configure pages, bind data sources, and preview layouts—often receives less scrutiny. It's used by fewer people. Its performance problems are attributed to "development overhead." Teams accept slow design mode as the cost of building applications.
We discovered that design mode surfaces the same architectural bottlenecks as run mode, often more severely. And the distributed connector pattern's benefits apply there too.
Important Context: Test Infrastructure
All testing was conducted on deliberately constrained infrastructure—below our recommended production sizing. We used constrained resources specifically to surface architectural differences under stress.
The ratios in this article reflect stress test conditions, not typical production experience. On properly sized infrastructure following our deployment guidelines, both architectures perform better in absolute terms. The relative differences between architectures remain instructive for understanding architectural trade-offs.
Why Design Mode Differs
Run mode serves content: render a page, return data, complete the request. Design mode has additional overhead—loading page metadata, handling draft versions, and retrieving connector data for data-bound blocks.
Every data-bound block on the design canvas triggers connector calls—the same connector loading cycle that affects run mode. But design mode users interact with pages repeatedly, tweaking properties and refreshing to see results. The connector loading overhead accumulates across each interaction.
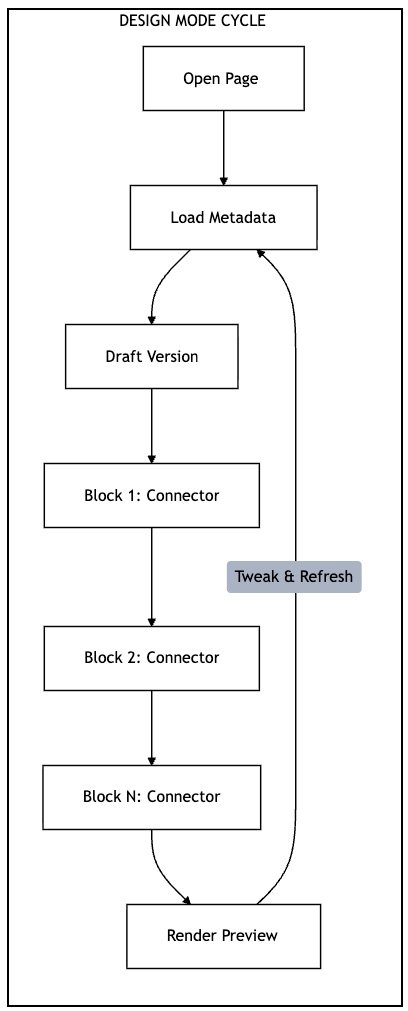
Each block triggers the full connector loading cycle. Repeated iterations multiply the overhead.
Test Design: Simulating Design Mode Page Loads
We simulated design mode page loads—the API calls triggered when a designer opens a page in Application Designer. Each page load includes authentication, page metadata retrieval, draft version handling, and connector data requests.
We used the same staged ramp-up pattern and threshold detection as the run mode tests (see Part 2 for methodology details).
The page under test contained one data source—the same configuration used in our single-data-source run mode tests.
The Numbers: Single Data Source
Page Loads Completed
| Metric | Distributed Advantage |
|---|---|
| Page loads | ~200× more |
| Success rate | Significantly higher |
The distributed architecture completed approximately 200× more page loads under stress test conditions. The in-process model reached its threshold quickly while the distributed model maintained consistent throughput.
Understanding the Comparison
These results—for pages with a single data source—require careful interpretation. The architectures reached their thresholds at very different load levels:
| Metric | Distributed Advantage |
|---|---|
| Concurrent users at threshold | ~13× more |
| Test duration | Much longer |
The distributed model handled approximately 13× more concurrent users before reaching the same p95 threshold. With multiple data sources, the gap widens further (see below).
Success Rates
The reliability difference is significant. With the in-process model, a meaningful percentage of design page loads failed or timed out—even at lower concurrency levels. The distributed model maintained high success rates at much higher concurrency. Failures were exceptional, not routine.
Multiple Data Sources: The Gap Widens
Design pages often contain multiple data-bound blocks. We tested design mode with 2 and 3 data sources:
| Data Sources | Distributed Advantage |
|---|---|
| 1 | ~200× |
| 2 | ~1000×+ |
| 3 | Orders of magnitude (in-process couldn't complete) |

As page complexity increases, the gap widens dramatically. With 3 data sources, in-process reached threshold before completing meaningful page loads.
On our constrained test infrastructure, the in-process architecture struggled significantly with complex pages:
- 2 data sources: Very limited throughput before threshold breach
- 3 data sources: Threshold reached before completing meaningful page loads
The distributed architecture maintained consistent throughput across all configurations, with high success rates regardless of data source count.
What this means in practice: On properly sized production infrastructure, in-process design mode handles typical team workloads adequately. However, for organisations with larger development teams or complex multi-data-source pages, the distributed architecture provides significantly more headroom.
The Developer Productivity Impact
Reliability Matters
Lower success rates in design mode translate to real productivity impact for developers:
- Retry overhead — Failed loads require refresh attempts, multiplying wait time
- Lost context — Failures interrupt workflow and break concentration
- Uncertainty — Developers can't distinguish between their changes causing issues versus infrastructure instability
The distributed model's high success rate at much higher load means failures are rare exceptions, not routine occurrences.
Team Scaling
The capacity difference directly affects how many developers can work simultaneously:
In-Process model (lower threshold):
- A small team of designers can approach design mode capacity limits
- Design work competes with production traffic for application server resources
- Teams may need to coordinate design sessions during peak periods
Distributed model (~13× more capacity):
- Same infrastructure supports significantly more concurrent sessions
- Design and production workloads can coexist
- Teams can scale development effort without infrastructure constraints
The distributed model doesn't just make individual developers faster—it allows more developers to work concurrently without degrading each other's experience.
Architectural Considerations
Why Design Mode is More Affected
Design mode shows a larger relative impact from connector architecture than run mode (~200× vs ~50× for single data source). Several factors contribute:
- Interactive patterns — Design mode involves repeated requests as developers iterate, amplifying per-request overhead
- Metadata overhead — Design mode loads additional configuration data alongside content
- Session duration — Design sessions are longer; cumulative overhead is more apparent
- Concurrency patterns — Developers often preview simultaneously after team meetings or standups
Shared Infrastructure
Design mode typically shares infrastructure with run mode. There's no separate "design server"—the same application server handles both workloads. This creates resource competition:
- A designer loading a complex page consumes the same connector loading resources as end users
- Slow design mode queries may hold database connections, affecting run mode
- Memory pressure from design mode assembly loading affects the whole process
The distributed model isolates this competition. Design mode connector calls go through the same message broker and stream host collection as run mode, but the application server isn't burdened with connector loading for either workload.
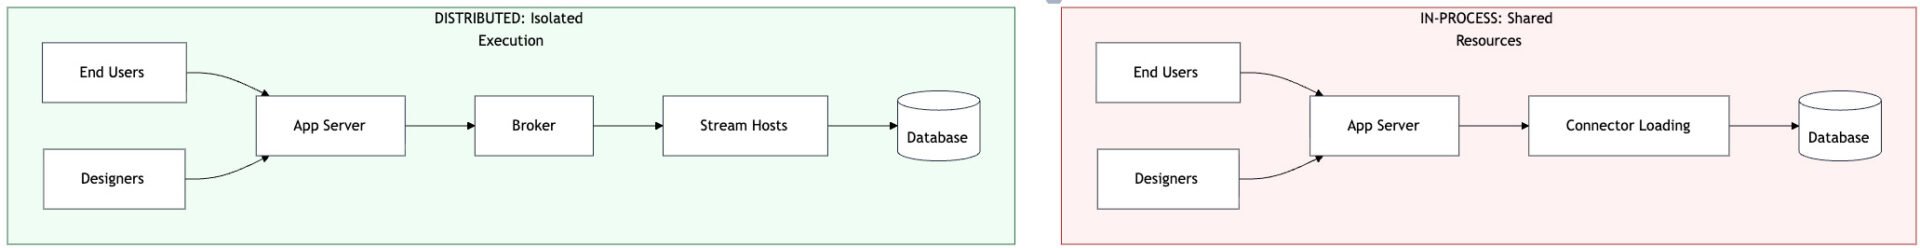
In-process: All workloads compete for app server resources. Distributed: Connector execution isolated to dedicated stream hosts.
Cache Behaviour
We noted in Part 1 that "live" connectors (those actively running streams) are cached in memory. Standard connectors have no server-level caching.
This caching differential explains some of the design mode performance variation. Designers working on pages with live connectors (connected to active data streams) may experience better performance than those working with ad-hoc connectors. The distributed model eliminates this variation—all connector execution happens in the stream host collection, regardless of connector type.
Measuring Developer Experience
Most organisations don't measure design mode performance as rigorously as production metrics. The load testing approach used here—simulating design workflows under concurrent load—provides an objective baseline.
Key metrics to consider:
- Design page load time (p50, p95) — How long do typical and worst-case design interactions take?
- Success rate — What percentage of design operations complete without error?
- Concurrent designer capacity — How many designers can work simultaneously without degradation?
If your development teams report "the design tools are slow," these metrics quantify the problem and provide targets for improvement.
Next in This Series
Performance isn't just about speed—it's also about capability. What happens when data volumes grow beyond "comfortable" sizes? Part 5 examines payload size limits and how distributed architecture changes what's possible.
This is part 4 of a series on distributed architecture patterns. The series draws on load testing conducted on XMPro Application Designer, comparing in-process SQL connectors with distributed stream-based connectors. The distributed connector capability is planned for an upcoming 2026 release.